This post is also posted here.
I’ve been teaching grade 9 Geography for over 15 years now and when I say 15 years, multiply that by two semesters and multiply that by at least two sections each semester. So many, many times. I’ve never been happy with how my “Landform Regions of Canada” lessons have turned out. I don’t know why but it’s very difficult for the students to connect their theoretical learning with pictures. I have tried graphic organizers with notes from the textbook, slide shows with many pictures, picture books and art from each landscape, videos, webquests, starting from the geological history, starting from issues based in each region, starting from national parks in each region, students presenting different regions/ecozone to the class. I wish I could take all the students on a cross-country drive so they can see it for themselves so I’ve been looking for a good VR experience (if you know of one, PLEASE let me know!).
Then there are the philosophy shifts. They need to know every region→ They only need to know that you can make regions based on different physical and human characteristics→ They can learn about one region in depth to understand interrelationships of land and people→ By doing an inquiry situated in one region, they will learn all the human and physical characteristics of the region and develop geographic thinking skills of spatial significance and interrelationships (depending on the issue)→ They need to know every region.
But isn’t that the beauty of teaching? We design learning experiences for our students, try them out, gather data through conversations, observations and products, reflect on how effective the learning experience was and redesign for the next course. In addition, what works for one group of students might not work with the next.
This big buildup is to introduce my newest iteration of Landform Regions of Canada. This time, I decided to take a constructionist approach.
- We started with the learning goals and how they connect with the course overarching learning goals.
- I discussed the learning theory of constructionism with the students.
- Then students were put into small groups and each student was assigned two landform regions to research. This was a strategy to foster increased positive interdependence of the group members. Each student’s research was required for the group to be successful.
- The groups were given a tiled map of Canada to assemble like a puzzle (from Canadian Geographic). I printed the document with four pages per letter size sheet and when completed, the map was about the size of chart paper.
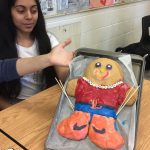
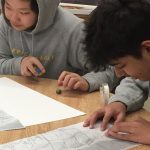
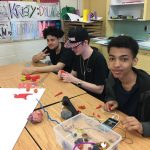
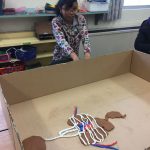
- The students were then required to create a 3D map of the landforms, vegetation and population distribution of Canada. This was facilitated by all the “low tech” makerspace supplies I have gathered including such items as plasticine, popsicle sticks, left over game pieces, styrofoam balls, fabric, tissue paper, Legos, Mechanics, blocks and all sorts of other craft supplies.
- What followed over the week was a lot of discussion and negotiation in the groups. Trial and error. My student teacher and I conferenced with the groups every day, asking probing questions about how they were going to represent each feature. Whole class discussions occurred about the importance of a legend, if many groups missed a feature and when they started putting too many people in the arctic, for example.
- Once the maps were done, we created a peer assessment Google Form with about 20 “look fors” for the map and “two stars and a wish.” Each student filled this out individually, not as a group, for three different maps→ meaning they read through the look fors once as a class while we made it, then at least three more times during peer assessment.
- The Google Form was used with DocAppender which pushed the answers from filling out the form to a specific student’s assessment document. Students read all the feedback they were given by their peers, then completed a self-assessment Google Form, also pushed to their personal document.

- This was followed by a Kahoot quiz on the Landform Regions. Unfortunately we ran out of time to do the full quiz, so we will do another one on Monday or I might do a formal quiz. We will develop the success criteria for the learning goals together.
- Eventually, the students will post their assessment document, a picture of the map and a reflection on their achievement of the learning goals in Sesame.
I don’t know yet if this constructionist strategy was successful. My gut feeling is that it has to be better since the students have touched the regions with their hands. They discussed, often passionately, how to represent each feature. Students co-constructed and used a list of look fors which are the main features of Canada’s landscape and population distribution. They literally constructed a map with four layers on it (provinces and territories, landform regions, vegetation regions and population density) so I am sure that they will understand GIS mapping concepts easier when I introduce digital mapping next week.
As a bonus, it was fun!


